
 When I give talks or do energy audits, people want to know the “best” ideas for saving energy. You know – the things that cut your energy bills in half and don’t cost much to implement.
Interestingly, this isn’t as crazy as it sounds. I’ve based my career on trying to give out as much practical information as possible. The theory is, if it’s easy and you can afford to do it, you’re much more likely to actually improve your home. This is as opposed to the idealist’s approach which promotes only doing things if you’re going to do them perfectly.
Without boring your further, let’s dive into five things that you can do to save energy in a meaningful way.
1: Know how to read your utility bill
By far the most important step to take is to learn how you and your home are using energy. This lets you prioritize your energy saving measures in a way that is most meaningful. I’ve seen people spend weeks caulking ares of their home that make absolutely no difference while leaving huge problems untouched.
I always recommend getting an energy audit as a starting point. However, the purpose of this article is not to get you to buy energy audits, it’s to teach you how you can do things yourself, so I’m going to skip that method.
The first thing is to look at your own utility bill. I can show you spreadsheets showing how other homes act, but there’s nothing like looking at your own utility bill.
![]()
Almost every electric bill has a graph like this one, showing a year or 13 months of usage data.
The vertical axis shows how much energy is used each month. In this case, it’s scaled from 0 to 2700 kilo-watt hours, or kWh.
Definition: a kWh is the amount of energy used by ten, 100 watt light bulbs in one hour. This is the same as one, 1000 watt heating pad. If it adds up to 1000 watts and it runs for one hour, it uses 1 kWh per hour.
I hope that’s clear, because everything about electricity consumption depends upon you understanding what a kWh is.
On the horizontal axis is months. In this case, it runs from September of 2008 to September of 2009. This lets you compare this year’s bill for September with last year’s bill. This is very handy since it shows you at a glance if anything has changed dramatically since last year.
What does this graph tell us?
Look at the pattern of usage. The graph shows similar electrical consumption during September, October, May, June and August. Each of these has a total usage of about 450 kWh for the month or about 15 kWh per day. I’d include July, but that actually shows a bit less consumption. Maybe the homeowner went on vacation for a week in July?
What do these months have in common? The answer is – you don’t heat your house in these months. Now, look at the heating months. (Side note: this is from a home in Eastern Pennsylvania. This is a very typical heating consumption curve.)
The graph shows electric usage increasing in November, December, peaking in January, then dropping in February, March, and April. This makes sense too since January is consistently cold, so you’d expect the most usage when it’s cold. So everything makes sense.
Take a step back. What does this graph say about the house? It says that the occupant is using electric heating in an amount that is related to the outdoor temperature.
I’ll tell you a secret – this house is heated with oil, so somehow, the owner was paying a double heating bill, once for electric and once for oil. So just looking at the electric bill tells me that there’s something very wrong with this home. After all, if the home is heated with oil, why are they paying for an extra 2,000 kWh in January? That’s $320 in added electric costs (in this area). Over the course of the entire winter, they’re using 5,200 kWh, or about $830!
Winter usage spikes usually means electric heating
We’re learning an awful lot by looking at one part of an electric bill. Without even looking at the house, you know that there’s something happening here that’s dramatically increasing their electric bills in the winter. Common sense shows us that the usage corresponds to winter temperatures so it’s extremely likely that they’re using electric space heaters somewhere in their home.
It’s also telling us that they don’t use air conditioning during the summer. If they did, the graph would jump up during July and August, which can be pretty hot and humid in these parts.
Baseline electrical usage
Go back to our earlier observation that most of the non-heating months show an electric consumption of 450 kWh per month. The average usage during the low-usage months corresponds to the baseline electrical usage. This is the amount used for things excluding seasonal loads like heating and air conditioning.
For most homes, the baseline electrical usage includes electricity used for televisions/electronics, electric lighting, clothes washers/dryers, computers, dishwashers, electric water heaters, etc. – things you use all year long.
In this particular case, they use 450 kWh per month, or 15 kWh per day. This is comparatively low. Most homes I measure have 25-50 kWh per day consumption as the baseline, so the graph also tells us that there is nothing that is excessively sucking down electricity in the home during the non-heating months.
Getting More Specific
We’ve spent a lot of time looking at the broad usage patterns. What about specific consumption? Suppose we saw something that caught our eye on the graph, like high baseline usage? What then?
Recall in the definition of kWh I wrote: “a kWh is the amount of energy used by ten, 100 watt light bulbs in one hour.” I defined it that way because it frames an abstract term “kilowatt-hour” in a way that anybody can wrap their brain around. Ten 100 watt lightbulbs burning for one hour. Easy!
So, a home that uses 15 kWh in a day is using as much as those ten lightbulbs would burn during the waking hours. That’s not bad considering it includes all the washing, drying, dishes, television, etc.
On the other hand, if you found that the home had a baseline of 45 kWh, that would be like 30 bulbs burning all day – ouch! In fact, when I see a high baseline electrical usage, one of the first things that I’ll do will be to walk around the house, basically counting lightbulbs.
Obvious Problems
Quite often, these homes will be newer ones filled with recessed lights in the kitchen, living and family rooms. I’ll point at the kitchen ceiling, filled with 15 brightly burning flood lights and ask – “how long are these on during a typical day?” The answer is usually “oh, we keep those on from the time we wake up until we all go to sleep.”
At this point, my face will usually show disapproval (I’m really bad at hiding my emotions!) and I will say something like “do you know that those 15 lights, each 90 watts, are consuming about 20 kWh per day? That’s more than the ENTIRE household consumption of many homes?”
Anyway, I digress. The point should be well taken. Sometimes, the cause of your high consumption is blindingly obvious!
Not-so Obvious Problems
That was an easy (but very common) problem. What about the harder ones?
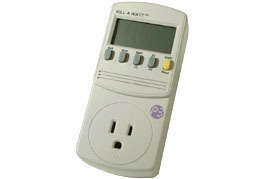
Well, sometimes, you just have to measure things, using a kill-a-watt meter like the one shown at the top of this post. This is a simple to use electric meter that any homeowner can use to measure the load of things that you plug in. For example, if you want to learn how much electricity that old fridge in the garage is using, just plug it in for a day and you’ll get a very accurate measurement.
Side note: occasionally, I’ll post links like this to items in the Ted’s Tips Amazon store. I’ve put together this store to hold all the items that I refer to on this blog so that you’ll be able to find them in one convenient place. Originally, I was linking to a lot of different sites, but then people would ask me where they could purchase them. Since I’ve been an Amazon user for years and know them to be extremely reliable and have low costs, I figured it was easiest to go this route. Anything you purchase there helps support this site. Thanks!
Back to measurements…
What Things Should You Measure?
You could spend months measuring everything in your house, but I’ll tell you where to start. These are the biggies. The proverbial “energy hogs.”
- Refrigerators, especially old ones or those in garages during the summer
- Dehumidifiers, especially those in damp basements or crawlspaces
- Space heaters
- Frequently used Halogen lamps
- Anything with a heater in it that gets used a lot
- Entertainment centers (especially large screen TV’s)
- Large stereo amplifiers that get used many hours a day
- Large gaming computer rigs
You should also make note of the following light fixtures. Keep track of the wattage of the bulbs and the length of time they burn each day.
- Outdoor lights, especially bright flood-lights
- Common area lights that are on most of the time (kitchen, living/family room, hallways)
I’m going to stop here for the day. This is more than enough to get you started doing your own home electrical consumption audit. If you follow these suggestions, learn how to read your utility bills and figure out how much energy you’re using, you’re well on your way to lowering your electric bill, maybe substantially. So get cracking – the watts are-a-wasting.
